 Global
 Singapore
 United States
 Hongkong
 Group
Group.jpg)
US Macro Strategy Weekly Report – 21 Aug 2023
James Ooi/ uSMART Market Strategist
Over 13 years of experience in buy-side and sell-side of capital markets
Former Fund Manager of renowned asset management firm
Focus on fundamental analysis and macro-outlook for US & Singapore markets
SGX Academy trainer
This Week’s Market Outlook:
- This week's important economic indicators in the United States comprise: Existing Home Sales on Tuesday, New Home Sales and PMI Data on Wednesday, Unemployment Claims and Durable Goods on Thursday, and the Jackson Hole Symposium on Friday.
- This week, companies representing 5% of the total market cap of the S&P 500 index will release their financial reports. Several important financial reports will be published on the following dates:
August 21st (Monday): Zoom
August 22nd (Tuesday): Baidu, Iqiyi, Macy's, Lowe's
August 23rd (Wednesday): Peloton, Grab, Nvidia, Snowflake, Autodesk
August 24th (Thursday): Dollar Tree, Marvell, Affirm, Futu, Intuit, Workday
- The narrative of "higher rates for longer" has resurfaced. The market's rally year-to-date has been contributed in part by expectations of accommodative monetary policies as It was widely expected that FOMC would commence rate cuts in January 2024, ultimately leading to FOMC rates falling within the range of 3.5-3.75% by the conclusion of 2024 (Figure 1). However, the most recent data from CME FedWatch now indicates that the market foresees the first rate cut occurring during the May 2024 FOMC meeting, with an expected year-end FOMC rate ranging between 4.25-4.5%. While US equity market was partly elevated year-to-date due to lower future discount rate, the higher interest rates now could mean equity market could start to decline in value.
Figure 1: FOMC Meeting Probabilities
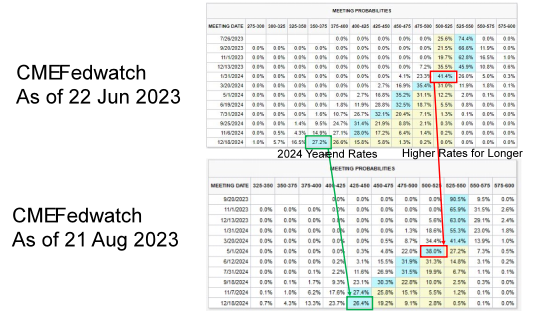
Source: CME Fedwatch, 21 Aug 2023
- We anticipate volatility to keep increasing based on seasonality (Figure 2). If history repeats, the volatility may rise till 12 Oct based on 25-year historical data.
Figure 2: VIX Seasonal Chart (Past 25 Years)
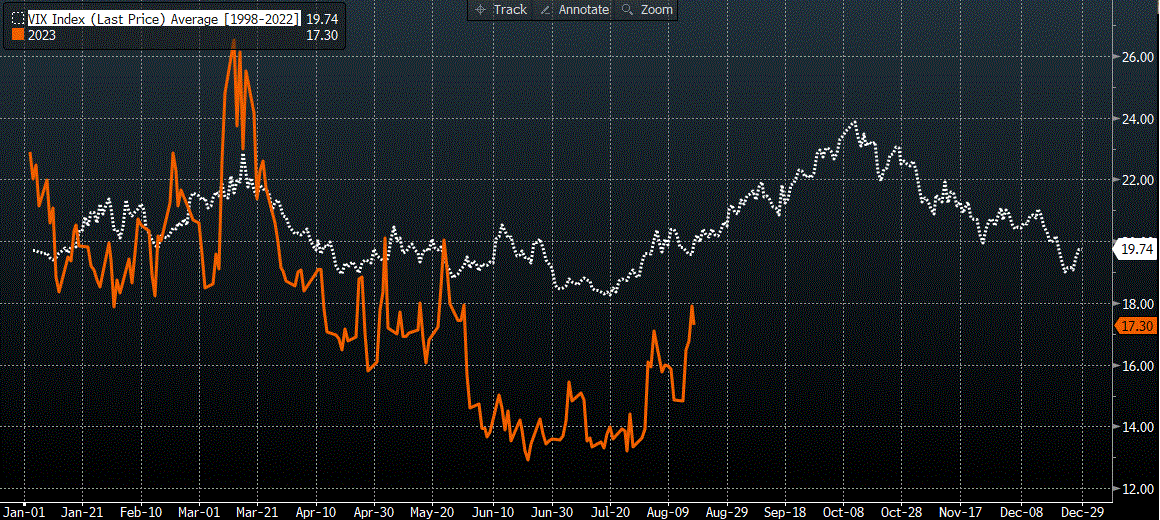 Source: uSMART, Bloomberg, 21 Aug 2023
- The data in Figure 3 illustrates years in which the S&P 500 yielded returns exceeding 10% in the first half of the year but performed poorly in the previous year. The average 2nd half performance stands at 12.92%. Historical records indicate that the second half of those years experienced an average drawdown of 6.47%, with 1975 exhibiting the most severe drawdown at 14.1%. If history repeats itself, drawdowns of 6% or 14% could result in the S&P 500 reaching levels of 4,223 or 3,865, respectively (Figure 4). We consider the worst-case scenario to involve a 20% drawdown, potentially pushing the S&P 500 down to the 3,600 level. However, a more prudent investment strategy would involve accumulating positions at drawdown levels of 6%, 14%, and 20%, rather than waiting for a 20% drawdown to occur.
Figure 3: In the year when the S& 500 returned more than 10% in the first half of this year, it was negative in the prior year (Since 1940)
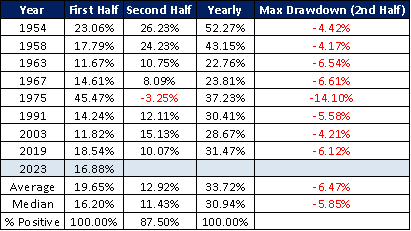
Source: uSMART, Bloomberg, 22 Jul 2023
Figure 4: Estimated Max 2H Drawdown
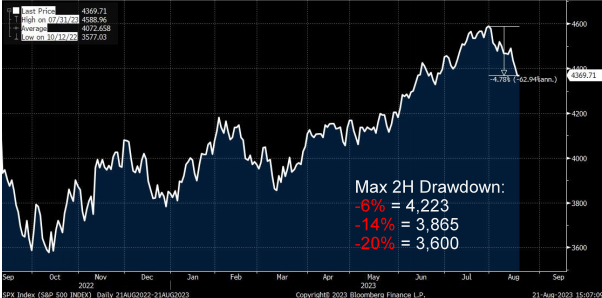
Source: uSMART, Bloomberg, 21 Aug 2023
Follow us
Find us on Twitter, Instagram, YouTube, and TikTok for frequent updates on all things investing.
Have a financial topic you would like to discuss? Head over to the uSMART Community to share your thoughts and insights about the market! Click the picture below to download and explore uSMART app!

Disclaimer:
This article is intended for general circulation and educational purpose only and does not take into account of the specific investment objectives, financial situation or particular needs of any particular person. You should seek advice from a financial adviser regarding the suitability of the investment products mentioned. In the event you choose not to seek advice from a financial adviser, you should consider whether the investment product in question is suitable for you.
Past performance figures as well as any projection or forecast used in this article, are not necessarily indicative of future performance of any investment products. Your investment is subject to investment risk, including loss of income and capital invested. The value of the investment products and the income from them may fall or rise. No warranty whatsoever is given and no liability whatsoever is accepted for any loss arising whether directly or indirectly as a result of this article. Overseas investments carry additional financial, regulatory and legal risks, you should do the necessary checks and research on the investment beforehand.
The information contained in this article has been obtained from public sources which the uSMART Securities (Singapore) Pte Ltd (“uSMART”) has no reason to believe are unreliable and any research, analysis, forecast, projections, expectations and opinion (collectively “Analysis”) contained in this article are based on such information and are expressions of belief only. uSMART has not verified this information and no representation or warranty, express or implied, is made that such information or Analysis is accurate, complete or verified or should be relied upon as such. Any such information or Analysis contained in this presentation is subject to change, and uSMART, its directors, officers or employees shall not have any responsibility for omission from this article and to maintain the information or Analysis made available or to supply any corrections, updates or releases in connection therewith. uSMART, its directors, officers or employees be liable for any or damages which you may suffer or incur as a result of relying upon anything stated or omitted from this article.
Views, opinions, and/or any strategies described in this article may not be suitable for all investors. Assessments, projections, estimates, opinions, views and strategies are subject to change without notice. This article may contain optimistic statements regarding future events or performance of the market and investment products. You should make your own independent assessment of the relevance, accuracy, and adequacy of the information contained in this article. Any reference to or discussion of investment products in this article is purely for illustrative purposes only, is not intended to constitute legal, tax, or investment advice of any investment products, and must not be construed as a recommendation, an offer or solicitation for the subscription, purchase or sale of the investment products mentioned. This article does not create any legally binding obligations on uSMART. uSMART, its directors, connected persons, officers or employees may from time to time have an interest in the investment products mentioned in this article.